
338 million attack simulations reveal the state of enterprise defense
First, a bit of good news: Enterprise defenses are recovering. However, it’s a narrow recovery, with a twist. Today, organizations are better at stopping loud attacks but have barely moved the needle at all against the quiet ones.
This data, and a lot more, comes straight from the newly published Blue Report 2026, the fourth annual comprehensive study from Picus Labs. Based on more than 338 million attack simulations run in real production environments in the first half of 2026, the report measures how enterprise prevention and detection actually performed against real attacks, from what controls stopped at the perimeter to what attackers can achieve once they’re inside.
Again, the recovery is real, but hold off on celebrating, as the findings underneath show how uneven it is. Here are the ones that matter most.
Prevention is strong at the perimeter, and weak inside it
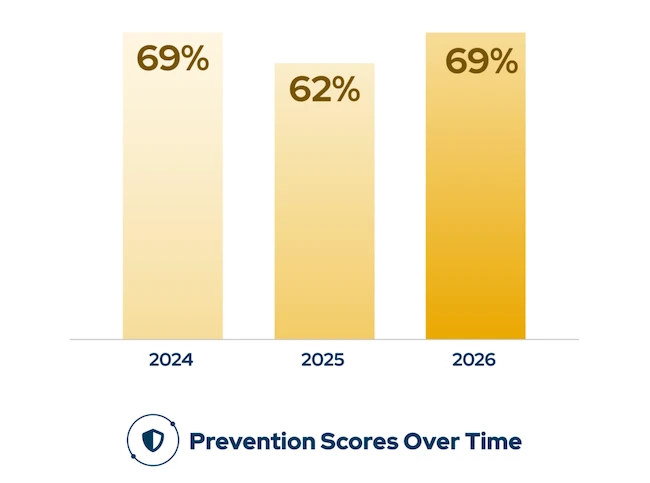
The top-line looks good. Average prevention effectiveness rose from 62% to 69%, back to its 2024 peak.
But it’s worth being precise about what that 69% is. It’s how often your security controls, everything from perimeter defenses to endpoint protection tools, actually blocked the attacker actions tested against them. A strong average across the whole stack.
The more revealing question is what happens once an attacker is already inside.
For the first time, Picus Labs also measured what happens after that boundary is crossed, using autonomous penetration testing to act as an adversary already inside the network.
Here’s where it starts to get really interesting. Post-compromise, only 37% of attacker actions were blocked.
Inside the domain, defenses stop roughly one action in three and let the other two proceed. The gap between that 37% and the 69% at the edge is the finding: perimeter and endpoint controls are up, but the assumption that an attacker who gets past them stays contained sadly doesn’t hold up under real-world conditions.
Inside, defenses catch the loud and miss the quiet
Lateral movement and privilege escalation, the actions that run code or jump between machines, were blocked 85-90% of the time. But reconnaissance, mapping the domain and enumerating shares and sessions was stopped only about 10% of the time, and reading credentials from memory was only detected around 22%.
An attacker can map the environment and harvest credentials with almost no resistance, all before the noisy step that would trip an alert.
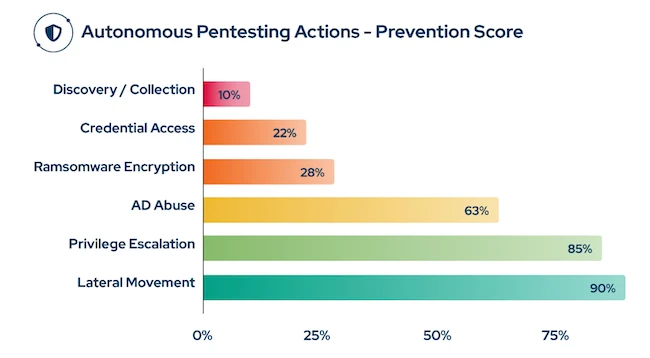
Picus Blue Report 2026, Autonomous Pentesting Actions
Average prevention score doesn’t show any of this, because they measure the different stages of the attack. Seeing it requires running the attack, which is what autonomous penetration testing does: it executes real attack paths within the network and reveals what an intruder could actually achieve once they’re inside.
The same tool was blocked 94% one way and 3% another
Across the simulations, one credential-theft tool, Mimikatz, produced sharply different results depending on how it was used.
- Dumping credentials from LSASS process memory, the classic signatured path, was blocked 94% of the time.
- Pulling them from other memory locations: Only 17%.
- Reading them from the local registry: A tiny 3%.
Same tool, same goal, same environments. The only variable? How recognizable the method was.
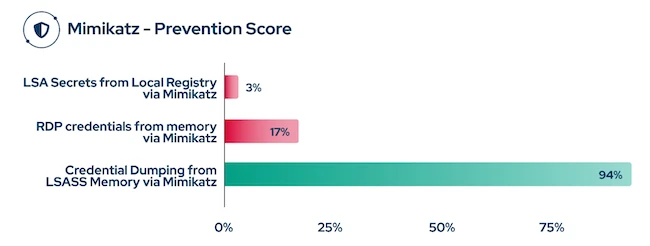
The reason is that a signature matches the famous version of this type of attack, not the behavior underpinning it. The LSASS path is loud and well-instrumented, while reading the registry looks like ordinary privileged activity.
And even the 94% was measured against one known build of Mimikatz, so a recompile, an in-memory load, or a signed Windows utility changes the fingerprint while the behavior stays identical. That is the core limitation of any prevention score built on signatures: it tells you how well you catch what you’ve already seen, not whether the behavior itself is being stopped.
The Mimikatz numbers come from the same autonomous testing, and that’s partially the point: only exercising the full range of an attacker’s methods, not just the well-known ones, will show you where your controls are quietly failing.
Malware prevention is falling even at the edge
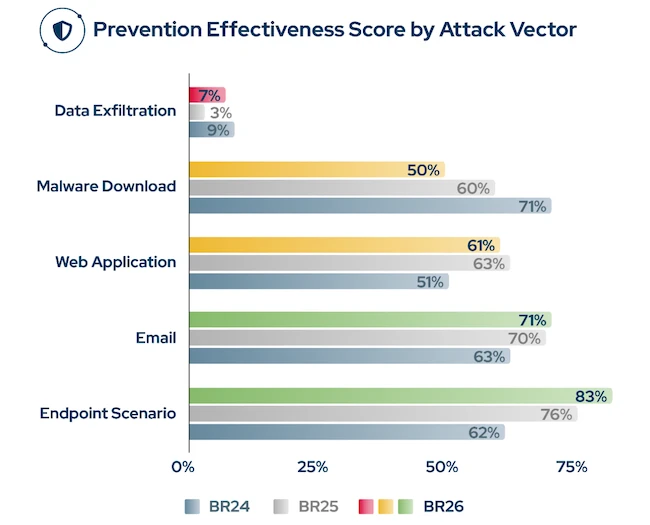
The IOC-based prevention rate for malware downloads fell to 50% this year, down from 60% in 2025 and 71% in 2024. That’s a 21-point decline in two years against one of the most well-understood attack vectors in security. This is not a good look.
But why?
The cause is structural rather than a lapse by any single product.
VirusTotal alone receives close to two million new files a day, and indicators scale with the adversary’s build pipeline: a payload can be packaged in countless ways, and a signature has to account for each one. Behaviors scale with the objective instead, and there are only so many ways to actually steal a credential.
This is why indicator-based and behavioral testing answer fundamentally different questions.
- IOC-based testing asks whether a control recognizes known-bad content, which is the role of perimeter defenses such as firewalls, web proxies, and secure email gateways.
- Behavioral, TTP-based testing asks whether a control stops the underlying action by any route, which is the role of the endpoint and detection stack once an adversary is inside and already executing.
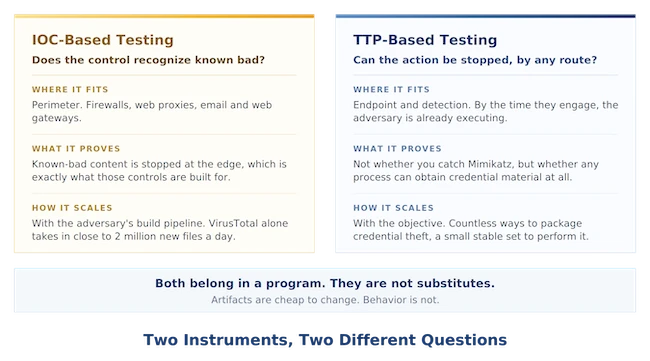
Both are essential, and neither can effectively substitute for the other. A breach and attack simulation solution needs to provide both.
On the IOC side, delivering current malware samples as download attempts remains one of the most practical ways to validate perimeter controls, including firewalls, WAFs, and secure email gateways, against what’s already known to be malicious.
On the behavioral side, an effective BAS platform must also run TTP-based testing against endpoint protection and detection tooling, including EDR, XDR, and SIEM, to confirm those controls stop the action itself and not merely the known file.
The least-prevented vulnerabilities cluster by weakness, not by vendor
Every one of the ten least-prevented vulnerabilities was blocked in under 25% of exploit attempts. We’ve grouped them by weakness class, memory safety and input handling in core libraries, and by local privilege escalation in operating system components, rather than by product or maker.
The same exploit techniques keep succeeding across different CVEs.
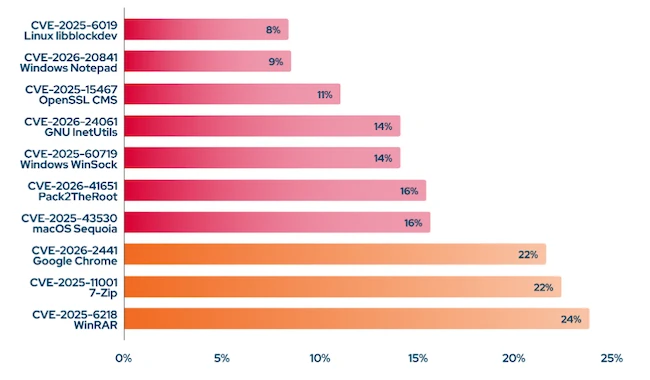
This makes a strong case against triaging by CVSS score alone.
The question that matters is whether an attacker can actually successfully chain a vulnerability’s techniques in your environment, against your specific defenses.
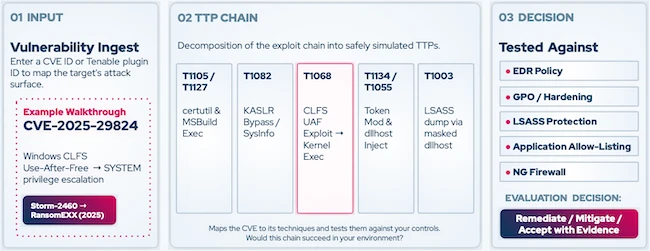
Exposure validation answers this question through TTP-chaining, breaking a CVE into the techniques an attacker must chain together and testing each against your controls, on the day of disclosure and without firing a live exploit.
The payoff is a defendable verdict on any CVE, on the day it lands, including the business-critical, air-gapped, and not-yet-weaponized systems that no live exploit can safely reach.
Logging is up, but still almost nothing turns into an alert
Everything so far has been about prevention, stopping the attack outright. Detection is the other half: when prevention fails, an alert is meant to bring in a human. This year, alerts are sitting at the same troublingly low number, 14%, where they were last year.
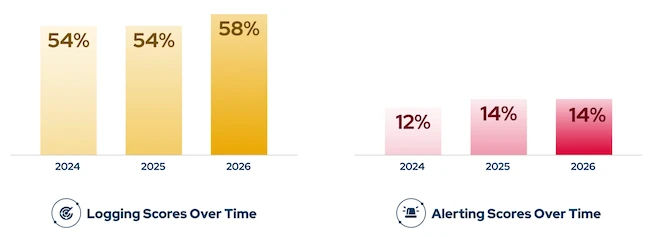
Logging rose, slightly, to 58%, but the alert score stayed flat at 14%, meaning fewer than one in seven simulated attacks produced an alert. Teams are collecting more telemetry than ever and turning almost none of that increase into viable action.
The log-to-alert gap has become a detection-engineering problem, not a data-collection one.
Strong performance is rented, not owned
This is the finding that ties the rest together.
Prevention fell against nine of the ten hardest-to-stop threat groups, and every top ransomware family was blocked less than 38% of the time, with Play collapsing from 50% to 13%.
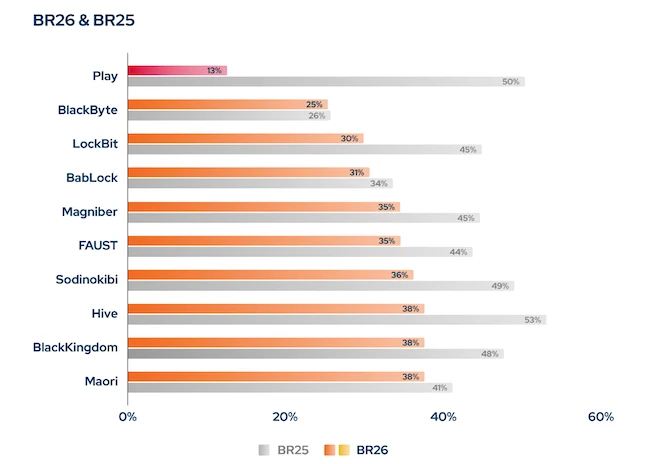
These are not obscure or novel adversaries. They are well-documented groups with published, widely analyzed tradecraft, and defenses still lost ground against them, because a signature for a known family does not cover the behaviors its operators actually run. Stopping them takes testing against their full, current kill chains, not recognizing their name.
That’s the through-line of the entire report: strong performance is rented, not owned, and it lasts only as long as the validation behind it.
Read the full report
What we’ve discussed here are just a small slice of this year’s findings. In its entirety, The Blue Report 2026 is a benchmark you can measure your own program against, and it goes well beyond what any single article can cover.

Grab your free copy today. Inside, you’ll find:
- Prevention and detection scores broken down by industry and region, so you can see how your sector actually performed this year.
- The MITRE ATT&CK tactics and techniques organizations block the least, mapped to where defenses break down.
- The threat groups and ransomware families prevention lost the most ground against, year-over-year.
- A full breakdown of the detection-rule failures responsible for the massive gap between logging and alerting.
- Practical guidance on how to close these gaps through continuous validation, from the perimeter to the deceptively quiet interior.
Download the Blue Report 2026 to see where enterprise defenses held, where they gave way, and where your own are most likely to fail.