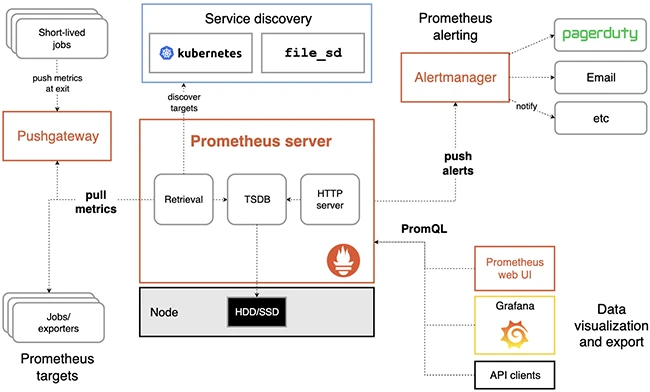
Prometheus: Open-source metrics and monitoring systems and services
Prometheus is an open-source monitoring and alerting system built for environments where services change often and failures can spread fast. For security teams and DevOps engineers, it has become a common way to track system behavior, spot early warning signs, and understand what is happening across large sets of workloads.

The project began at SoundCloud and is now hosted by the Cloud Native Computing Foundation, where it sits alongside Kubernetes and other core cloud-native tools. Prometheus is designed around a simple idea, collect metrics from systems, store them locally, and make them easy to query and alert on.
A metrics model built for scale
Prometheus uses a time series data model. Every metric is stored with a name and a set of labels that describe the source. Labels can include details such as service name, instance, region, or role. This structure lets teams slice and group data without redefining metrics every time infrastructure changes.
Metrics are numeric and sampled at regular intervals. That makes them suitable for tracking system health indicators like CPU usage, memory pressure, request rates, and error counts. For security teams, the same model can support signals such as authentication failures, unusual traffic spikes, or service restarts.
Prometheus stores data locally on disk. The design avoids a dependency on remote storage during collection, which helps keep monitoring available during outages or network issues. Long-term storage can be added through remote write integrations when needed.
Pull-based collection and service discovery
One of the defining features is its pull-based approach to data collection. Prometheus scrapes metrics from targets over HTTP at defined intervals. Each target exposes a metrics endpoint, often at a standard path.
This model fits dynamic environments. Prometheus includes service discovery mechanisms for platforms like Kubernetes, cloud providers, and virtual machine fleets. Targets can appear and disappear without manual updates to configuration files.
Security teams benefit from this approach when monitoring ephemeral workloads such as containers or short-lived jobs. Visibility does not depend on agents pushing data to a central point, which can reduce complexity and limit the risk of blind spots.
PromQL gives teams direct answers
Prometheus includes its own query language called PromQL. The language is designed to work directly with time series data. Queries can filter metrics by label, calculate rates, aggregate values, and compare current behavior with historical baselines.
PromQL is used across the Prometheus ecosystem. Dashboards, alerts, and ad hoc investigations rely on the same query language. That consistency helps teams share queries and understand each other’s work.
For incident response, PromQL supports fast exploration. Teams can ask focused questions such as which services are seeing rising error rates or which nodes are under memory pressure right now.
Alerting tied to behavior, not static rules
Prometheus includes an alerting system that evaluates PromQL expressions over time. Alerts fire when conditions hold true for a defined duration. This reduces noise from brief spikes or transient issues.
Alerts describe symptoms rather than events. A rule might watch for sustained increases in failed login attempts or sudden drops in service availability. Alertmanager, a companion component, handles grouping, routing, and notification delivery.
This approach aligns with how security and operations teams work during incidents. Alerts point to patterns that need attention instead of individual log entries.
An ecosystem that grows with the platform
Prometheus has a large ecosystem of exporters that expose metrics from databases, operating systems, network devices, and applications. Many security tools and infrastructure platforms provide Prometheus-compatible endpoints by default.
The project documentation emphasizes simplicity and composability. Prometheus does one job, collect and query metrics. Visualization tools like Grafana and long-term storage systems can be added without changing the core design.
Prometheus is available for free on GitHub.

Must read:
- 40 open-source tools redefining how security teams secure the stack
- OpenGuardrails: A new open-source model aims to make AI safer for real-world use

Subscribe to the Help Net Security ad-free monthly newsletter to stay informed on the essential open-source cybersecurity tools. Subscribe here!
